
Get your strategy off paper
Strategy execution: you in command, from plan to result
The strategy is drawn up. The objectives are clear. What decides the result is what happens between one meeting and the next, and that is where Stratws works: every objective tracked by the indicator that measures it, every deviation with the correction opened at the same point where it appeared.
73.32% of the nearly 8 million goals tracked in Stratws were met or exceeded










The same strategy, visible to the whole company
Objectives, indicators, meetings, initiatives and course corrections live in the same management routine. That routine is what sustains execution once the planning is done.
With a single source, each leader answers for what they track, and senior management decides faster, on reliable, traceable numbers instead of loose spreadsheets, slides and dashboards. In the results meeting, you arrive with what was done, without improvising and without the feeling of defending a number with no backing.
From objective set to result achieved
Follow the whole cycle, from the strategy map to the analysis that backs the next decision.
The strategy map leaves the slide
The cycle's objectives and goals are visible in Stratws, with the linked indicators, and strategy stops living in a separate presentation.
Feeding the platform is simple
Data integrated from the ERP, the BI and the tool the company already uses, or entered from your AI by conversation. Source, formula, owner and frequency are decided, and the indicator is standardized.
Every area knows what it must deliver
The executive team's goal flows down the indicator tree to the individual, and each area sees clearly the goal it answers for.
The deviation becomes action before it becomes a problem
You record fact, cause, action, owner and deadline at the point where the indicator went off target.
A layer of intelligence in your analysis
The AI you already use cross-references the structured data in Stratws with the context of your routine, and you arrive at an in-depth reading of the deviation, not just its value.
Area presentations become fast and standardized
With the indicators already centralized, assembling the results presentation drops from days to about 2 hours.
Use your history in decision-making
The lessons from each cycle are recorded on the platform: the mistake is not repeated, and what the area learned becomes knowledge that stays.
What has already been tried stays at hand
Each previous action appears with the cause that prompted it and the result that followed. You decide by looking at what the area has already learned, and you do not restart the attempt that failed.
The indicator needle moves
The action checked in the next cycle shows whether the indicator that should have reacted did react. That is how learning becomes results, and not just a record.
The whole execution on one platform
Spreadsheets, dashboards and other tools support part of management. Stratws covers the whole path, from the strategy map to the result, with no need for other tools.
| What execution requires | Stratws | Spreadsheet | BI and dashboards | Other tools |
|---|---|---|---|---|
| Gather the number from several sources | Yes | Yes | Yes | Yes |
| Show the deviation clearly | Yes | Partly | Yes | Yes |
| Every indicator with a defined source, formula, owner and frequency | Yes | No | No | Partly |
| The deviation becoming an action plan with owner and deadline, in the same place | Yes | No | No | No |
| The results meeting with agenda, minutes and follow-ups linked to the indicator | Yes | No | No | No |
| The decision history carrying across cycles and team changes | Yes | No | No | No |
The platform sustains the method you practice
Balanced Scorecard, OKR, strategy map, PDCA, FCA, See and Act, Five Whys, Ishikawa, 3W, 5W2H and Kanban, among others. Your company runs management with a methodology behind it, instead of following intuition, in building the result.
Understand each method
Stratws, your AI platform working alongside your strategy
Secure a layer of analysis over strategy execution. Stratws AI crosses indicators, meeting minutes and action plans with the context of your business, and shows why the objective drifted and which correction comes first.
- What fell short of the goal, with the calculation and the overdue tasks.
- The meeting minutes ready, with decisions, owners and deadlines.
- Querying, entering and updating in a single conversation.
Grupo SBF: strategy reaching 10,000 people
Grupo SBF is sports retail, bringing together Centauro, FISIA and SBF Ventures, and overcame the challenge of fragmented communication between units and the difficulty of aligning goals in an expanding operation.
Watch the full case on YouTube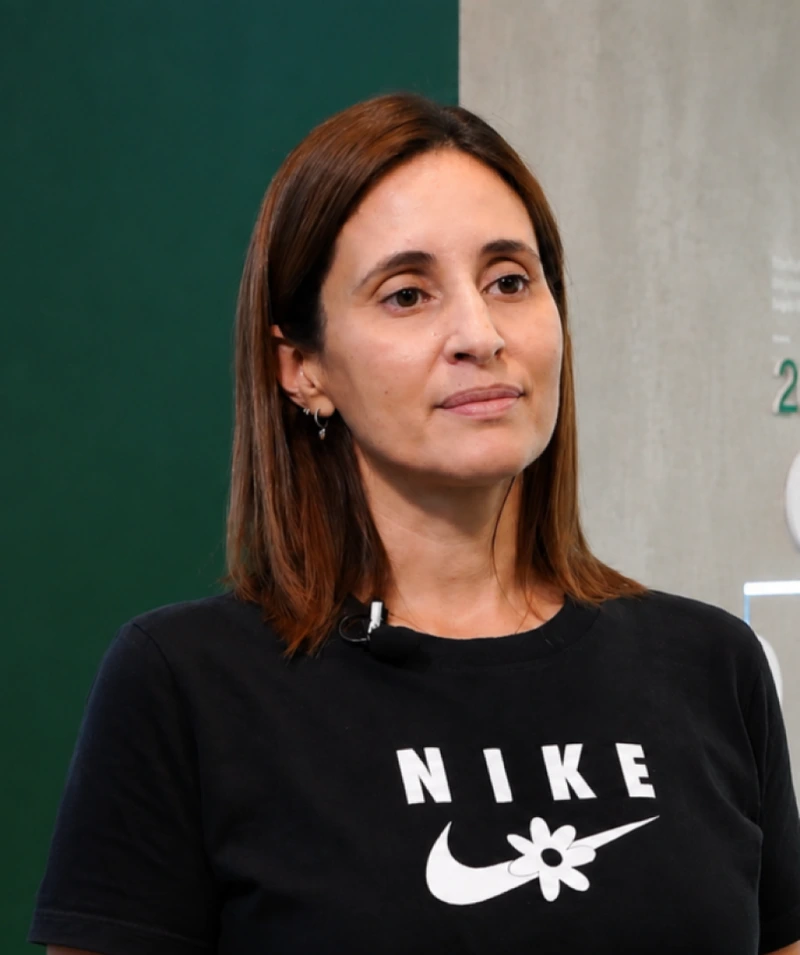
“It is not enough to deploy the strategy. We need it to reach every level of the company in a clear and cohesive way.”
Renata CarmonaResults Management Coordinator · Grupo SBF

Your strategy under global security standards
Protecting the company's sensitive data is handled in layers, so the information stays confidential and intact from entry to audit.
Permission by profile
Who edits the indicator, who enters the value and who only follows the result are distinct, configurable roles, from executive leadership to the front line.
Audit trail
Every change is recorded with date, time, user and the before and after, which backs the historical series in an audit.
Privacy assured
Stratws complies with European (GDPR), Brazilian (LGPD) and Californian (CCPA) information privacy regulations.
International security standard
Hosting runs on Azure and AWS, with an isolated environment per client, and Siteware is SOC 2 compliant, with AICPA standards applied to its processes.
Bring your strategy to Stratws
The next executive leadership meeting does not have to be about justifying the number. Tell us how your management is tracked today and, in a conversation, we show in practice how Stratws puts you in command of your own execution to reach the result.