
Continuous Improvement
Ishikawa Diagram: What It Is and How to Make One (Template)
Learn what the Ishikawa Diagram is, how to build one step by step, and how to find the root cause of failures. Examples and Stratws template.

The Ishikawa Diagram, also known as the Fishbone Diagram or Cause and Effect Diagram, is an essential quality tool for analyzing processes, detecting problems, and identifying causes, with the goal of achieving operational excellence.
It helps companies identify the root cause of problems, allowing teams in many industries, such as food, pharmaceutical, and manufacturing, to find effective solutions to different pain points.
That is why the Ishikawa Diagram is so important in quality management, productivity, and continuous improvement processes.
In this article, you will learn what the Ishikawa Diagram is, get to know its history, understand what it is used for, see practical examples, and find out how to apply this tool step by step in your company.

What is the Ishikawa Diagram?
The Ishikawa Diagram is a visual tool used to identify the root cause of a specific problem. It is called a “fishbone” because its graphic representation resembles the structure of a fish.
The idea is that a single problem is evaluated across different areas (usually six), until the cause of its occurrence is identified.
- The “head” holds the problem (the effect).
- The main “bones” list the categories of causes, known as the 6Ms: Machine, Method, Material, Manpower, Mother Nature (environment), and Measurement.
- From these, the possible secondary causes that may be contributing to the problem are added.
This makes it much easier to act on a problem and solve the pain point than to act on a symptom. That is why it is widely used in continuous improvement processes.
The proposed structure helps teams see all the possibilities and discuss them together, reaching the root cause of failures and bottlenecks faster.
Where does the Ishikawa Diagram come from?
Developed by Japanese engineer Kaoru Ishikawa in the 1940s, this method is one of the most efficient for root cause analysis of many kinds of problems. According to what Ishikawa himself documented, and as modern academic analyses report, the visual application of this tool together with basic statistical methods can map and solve up to 95% of organizational problems.
In addition, other studies, such as those published in the journal Global Journal on Quality and Safety in Healthcareopens in a new tab (2024), show that structuring investigations with this diagram drastically reduces the time and resources improvement teams spend.
Ishikawa’s innovative approach turned the tool into a method widely adopted across many sectors, contributing significantly to operational efficiency.
What is the Ishikawa Diagram used for?
The Ishikawa Diagram is used mainly to analyze the causes of problems and support decision-making in improvement processes.
It is very useful in quality management, productivity, and innovation, because it organizes information in a visual and collaborative way.
The tool has many applications, as we have seen, but in short it serves to:
- Identify root causes, distinguishing them from symptoms, and enable precise corrective actions.
- Improve operational efficiency and reduce waste.
- Analyze collaboratively, encouraging teamwork in identifying and solving problems.
- Support total quality programs and ISO certifications.
- Promote the identification of opportunities to optimize processes.
- Prevent problems by solving the root cause and, as a result, significantly reducing the recurrence of failures.
- Work alongside other methodologies, such as the PDCA Cycle or the 5 Whys.
Advantages of using the Ishikawa Diagram
The Ishikawa Diagram increases clarity and, as a result, helps define action plans. It is also a simple, practical, and low-cost tool.
Here are the other benefits for companies:
- Efficient identification: makes it easier to tell symptoms from underlying causes.
- Continuous improvement: encourages systematic analysis, promoting constant refinement.
- Teamwork: fosters collaboration among professionals from different areas.
- Clear visualization: makes it possible to understand and prioritize causes.
- Lower cost and time: improves process efficiency and shortens the time to solve problems.
- Recurrence prevention: eliminates the root cause, reducing the chance of the problem coming back.
When to use the Ishikawa Diagram
The tool can be applied in many situations, in different types of companies, with the main goal of solving problems more efficiently and quickly.
The Ishikawa Diagram is useful for:
- Recurring problems: identifying the root cause of persistent failures.
- Process analysis: mapping inefficiencies in industrial, service, administrative, or IT environments.
- Brainstorming sessions: promoting in-depth, collective discussions.
- Continuous improvement projects: identifying critical points that need optimization.
Once the root cause of a problem is identified, decisions have to be made about what to do. In parallel, decision-making tools can be great allies.
How to build an Ishikawa Diagram
It all starts by filling in the “head of the fish” with the problem you want to solve. Then you define the scenarios in which you will evaluate the problems.
Most companies choose the 6Ms, but you can customize them to the characteristics of your operation.
The 6Ms are:
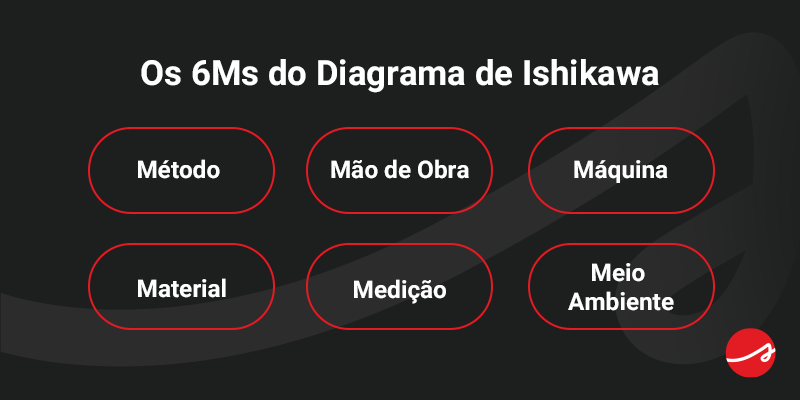
- Method: refers to how the work is being done. Here you describe possible problems related to processes and procedures, such as lack of standardization or unnecessary steps.
- Manpower: covers people, skills, and motivation. Problems with team training or a lack of clear communication can compromise the quality and efficiency of the work.
- Machine: covers equipment, technologies, and tools with possible defects. List concrete problems with machines or software that affect the result.
- Material: includes the raw materials, components, and supplies the process needs. Identify problems related to the quality, quantity, or suitability of raw materials or supply.
- Measurement: covers how performance is monitored, measured, and controlled. You can include failures that hinder the process, such as using the wrong metrics or lack of monitoring.
- Mother Nature (environment): refers to the physical, organizational, and even cultural conditions surrounding the process. Record factors in the physical and organizational environment that may contribute to the problem, such as temperature, noise, and extreme weather.
Read also: What is the 5W2H methodology? Learn the concept and how to apply it in action plans
Practical example of the Ishikawa Diagram
Let’s start with a simple problem that is common in many companies: frequent delays in delivering orders to customers.
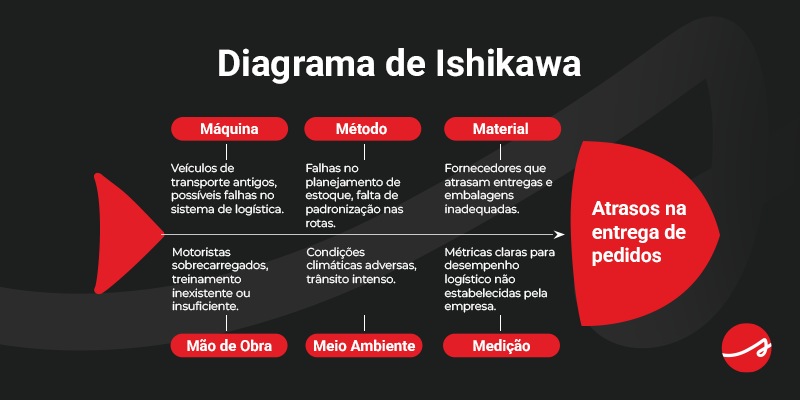
To think through possible solutions and causes of the problem, we will build the Ishikawa Diagram (fishbone) using the 6Ms to illustrate how problems are identified:
- Machine (equipment): old transport vehicles, possible failures in the logistics system.
- Method (processes): flaws in inventory planning, lack of standardized routes.
- Material (supplies): suppliers that deliver late and inadequate packaging.
- Manpower (people): overloaded drivers, nonexistent or insufficient training.
- Mother Nature (environment): adverse weather, heavy traffic.
- Measurement (indicators): clear metrics for logistics performance not established by the company.
During the analysis, the company’s team found that 80% of the delays were related to flaws in route planning (Method) and problems with suppliers (Material).
This made it possible to build an action plan to prioritize solutions such as redesigning routes and selecting new suppliers with clear quality indicators for efficiency analysis.
Visual example of the Ishikawa Diagram
Below, see how an Ishikawa Diagram would be filled in for the situation used as an example above:
The fishbone can also be built in management software.
Stratws, for example, offers customized templates for the Ishikawa Diagram and other problem-solving and management tools.
Turn diagnosis into action with Siteware
The Ishikawa Diagram is excellent for finding the root cause of failures, but the diagnosis loses its value when action plans stay on paper. For continuous improvement to become a reality, you need to move away from scattered information and connect strategy to execution.
With Stratws, the corporate management software from Siteware, you centralize everything. Through the Improvement Opportunity Module, your team resolves deviations and tracks action plans quickly on a platform with very high security and SOC 2 compliance.
Frequently asked questions
What is the Ishikawa Diagram and what is it used for?
The Ishikawa Diagram is a tool that visually maps all the possible causes of a problem, allowing the team to identify the root cause and implement lasting solutions.
How do you do an Ishikawa analysis?
1. Clearly define the central problem (effect).2. Choose the cause categories, usually the 6Ms: Method, Machine, Material, Manpower, Measurement, and Mother Nature (environment).3. Brainstorm and organize the primary and secondary causes by category.4. Build the diagram with a central spine pointing to the problem and branches for the categories and sub-causes.5. Analyze and plan actions based on the causes identified, validating hypotheses before carrying out the action plans.
What are the main mistakes when building an Ishikawa Diagram?
The most common mistakes are confusing symptoms with the root cause of the problem, filling in the diagram alone (without involving the team), and not putting action plans into practice after the diagnosis.
When should you use the Fishbone Diagram?
- Continuous improvement projects (Lean, Six Sigma, PDCA, DMAIC).- Solving quality problems.- Product launches.- Diagnosing administrative or operational failures in services and production.
Can the Cause and Effect Diagram be used in any area of the company?
Yes. Although it is widely used in industry, the diagram can be applied to diagnose failures and find solutions in any area, including service delivery, administrative routines, and IT.
What is the purpose of the Cause and Effect Diagram?
The purpose of the Cause and Effect Diagram is to systematically identify all the causes that can lead to a problem, allowing the team to focus on the root cause and implement effective, preventive solutions.
What are the 6Ms of the Ishikawa Diagram?
The 6Ms are: Method, Manpower, Machine, Material, Measurement, and Mother Nature (environment). Each of these elements is analyzed to identify its possible contribution to the problem.
What are the variations of the Ishikawa Diagram?
The traditional model is based on the 6Ms. However, because the diagram is flexible, the categories can be customized. Very common variations in the market include the 4Ps (Policies, Procedures, People, and Plant, widely used in services) and the 4Ss (Suppliers, Systems, Surroundings, and Skills).
What is the difference between the Ishikawa Diagram and the 5 Whys?
The Ishikawa Diagram visually organizes all the possible causes.The 5 Whys go deeper into one specific cause by asking "why" repeatedly.

About the author
Equipe Siteware
Content produced and reviewed by the Siteware team, curated by internal experts in strategic management and corporate performance.