
Continuous Improvement
5 root cause analysis tools to guide your decision-making
Make decisions faster and more accurately with root cause analysis tools. See 5 methods, from Pareto to 5 Whys, and stop piling up problems.

Many organizations today are stuck in an endless cycle of “putting out fires”: dealing with the immediate consequences of problems without addressing where they come from. In that scenario, root cause analysis offers a lasting cure for corporate challenges.
Root cause analysis is a systematic approach to identifying the fundamental causes of problems, instead of just treating surface symptoms. Once you reach the root of the problem, the analysis lets companies act directly on the solution.
However, there are different methods and tools for doing this analysis.
Want to know which tools can help you identify and run a root cause analysis of the problems in your routine and in your company? Keep reading and find out!
Also read: Problem-solving tools: 8 tips and software

What is root cause analysis?
Root cause analysis (RCA) is a method used to identify the fundamental causes of problems or failures in a process or system, instead of just treating their symptoms. The goal is to understand the underlying origins of problems so you can implement lasting solutions and prevent them from happening again.
When a problem occurs, it is often easy to treat only the immediate symptoms. However, without understanding and addressing the underlying causes, the problem can come back. Root cause analysis goes beyond the obvious symptoms to find the factors that really caused the problem.
The process usually involves collecting data, analyzing that data to identify patterns or failures, identifying the underlying causes and, finally, implementing and monitoring corrective solutions.
By running a root cause analysis, organizations can implement more effective solutions, improve processes, increase customer satisfaction and avoid the costs of recurring failures.
- Inside Stratws, the software developed by Siteware, you can use several root cause analysis tools, such as Pareto Analysis and the Ishikawa Diagram. Learn more →
The difference between cause and effect
Imagine you wake up in the morning and feel like you have a fever. That is an effect, right? The fever is a visible sign that something is wrong in your body. But the fever alone is not the real problem. You can take medicine to bring your temperature down, but if you do not treat the cause, it can happen again, and even worse.
Now think of the root cause as the real problem producing the fever. It could be an infection or a virus. To treat the fever effectively, you need to identify and treat that root cause.
Taking that idea to companies, imagine an online store that starts receiving many customer complaints saying that the products delivered are damaged. Those complaints are the effects of a problem. To solve it, the company could offer refunds, but that would not eliminate the root of the problem.
To find the root cause, the company needs to dig deeper.
In this hypothetical scenario, the problem is in transportation, where products are being handled improperly. By identifying the root cause, the company can make specific changes that keep products from arriving damaged in the future, avoiding losses at scale.
Example of using root cause analysis
When it comes to root cause analysis, people are often used to treating the symptom and not the cause itself. That is why I developed two similar examples of a company: in one, the team dealt with the root of the problem, while in the other, it dealt with the symptom itself:
Scenario 1: Identifying the root cause and solving the problem
Imagine a factory facing a recurring problem of low productivity on one of its production lines. After a detailed analysis, the management team discovers that the main root cause of this problem is a lack of preventive maintenance on the machines, which kept stopping more than they should.
This resulted in frequent production stoppages caused by unexpected machine breakdowns. As a solution, the company implements a strict preventive maintenance program on weekends, making sure the machines are regularly inspected and maintained.
As a result, productivity on the production line increases significantly and unplanned stoppages during working hours drop sharply.
Scenario 2: Treating only the symptoms
At another company, also facing productivity problems on a production line, management simply decides to add more employees to the line to make up for the low productivity.
Although this may temporarily improve production numbers, it does not solve the underlying problem. Over time, labor costs rise and the overall efficiency of the operation stays compromised because of the unresolved root cause, which could be, for example, an inadequate manufacturing process or a lack of proper employee training.
When should you run a root cause analysis?
Root cause analysis is a technique used to identify the fundamental origin of problems or failures, with the goal of solving not only the symptoms but also the underlying causes.
If a specific problem keeps happening despite attempts to fix it, that is a clear sign that previous solutions addressed only surface symptoms and not the fundamental causes.
In addition, any event that results in significant loss, whether in safety, quality, time or cost, should be analyzed in depth to prevent it from happening again. This can include workplace accidents, failures of critical equipment or major production errors.
Likewise, when reviewing and optimizing existing processes, root cause analysis can be used to identify bottlenecks, inefficiencies or risks that are not obvious at first glance.
How do root cause analysis tools work?
Root cause analysis tools work differently from one another. In general, though, they follow a flow that starts with defining the problem, checking the reasons, looking for solutions and planning at the strategic and tactical levels, and ends with tracking the results.
See the 7 best strategic planning tools and systems →
To picture it better, here is the order of the root cause analysis process in general terms:
- define the problem;
- identify the possible causes;
- verify the real causes;
- propose a solution to the problem;
- implement the solution;
- analyze the results.
At the senior management level, cause and effect analyses are usually applied to goal deviations, to identify the main factors that led to a missed result in that period.
By treating the causes of the deviation, managers try to keep the goal close to the value to be reached and, therefore, aligned with the company’s expectations. This way, the methodology can help optimize processes and improve results.
5 main root cause analysis tools
There are several root cause analysis tools, each with its own particularities. We have gathered the four main ones, considered the most used in the market by companies of different sizes and industries: Pareto Diagram, Ishikawa Diagram (fishbone), 5 Whys Method and Check Sheet.
It is up to the team to decide which of them best fit their own reality.
After applying any of these tools, it is important to check whether it solved the problem. That way, you can replicate the process in different situations.
Watch (in Portuguese):
1. Pareto Diagram
The Pareto Diagramopens in a new tab is a practical example of a root cause analysis tool that lets you identify and select the items responsible for a large effect on process improvement, following the ratio: 80% of results are caused by 20% of factors.
That is the concept behind Pareto analysis: 80/20.
From the standpoint of identifying problems, you can say that 80% of problems can be solved by treating 20% of the causes.
So, to build a Pareto Diagram, you should:
- Identify a goal that was not met in a given period;
- List the possible problems that caused the deviation from the goal;
- Assign the frequency with which they appear or their degree of relevance;
- Sort the data in descending order by frequency and importance;
- Calculate the percentage for each item and create a new column with the cumulative percentage of the series;
- Create a chart where the columns represent frequency and the line represents the cumulative percentage;
- Select the problems that, with their percentages added up, represent 80% of the factors.
You can learn more about this root cause methodology by reading these posts on our blog:
- How to build a Pareto diagram and apply it to your businessopens in a new tab
- Understand everything about Pareto analysisopens in a new tab
If you want to run this methodology for root cause analysis and decision-making, download our tool:

2. Ishikawa Diagram
The Ishikawa Diagramopens in a new tab, also known as the Cause and Effect Diagram or Fishbone Diagram, is a graphical tool widely used to analyze problems.
Thanks to its hierarchical form, it lets you group and visualize several causes considered to be the origin of a problem. It can also help identify an improvement opportunity, along with its effects on the challenge or the result.
In its structure for analyzing cause and effect to find the root cause of the problem, building the Ishikawa Diagram follows these steps:
- Determine the problem to be analyzed;
- Gather information about the problem;
- Hold a brainstorming session with the team about the problem, listing possible causes, both primary and secondary;
- Identify the most relevant causes and group them according to the 6Ms;
- Propose solutions for the causes listed, assigning one person to be responsible for implementing the solution.
See a root cause analysis with this example of how to build an Ishikawa diagram:
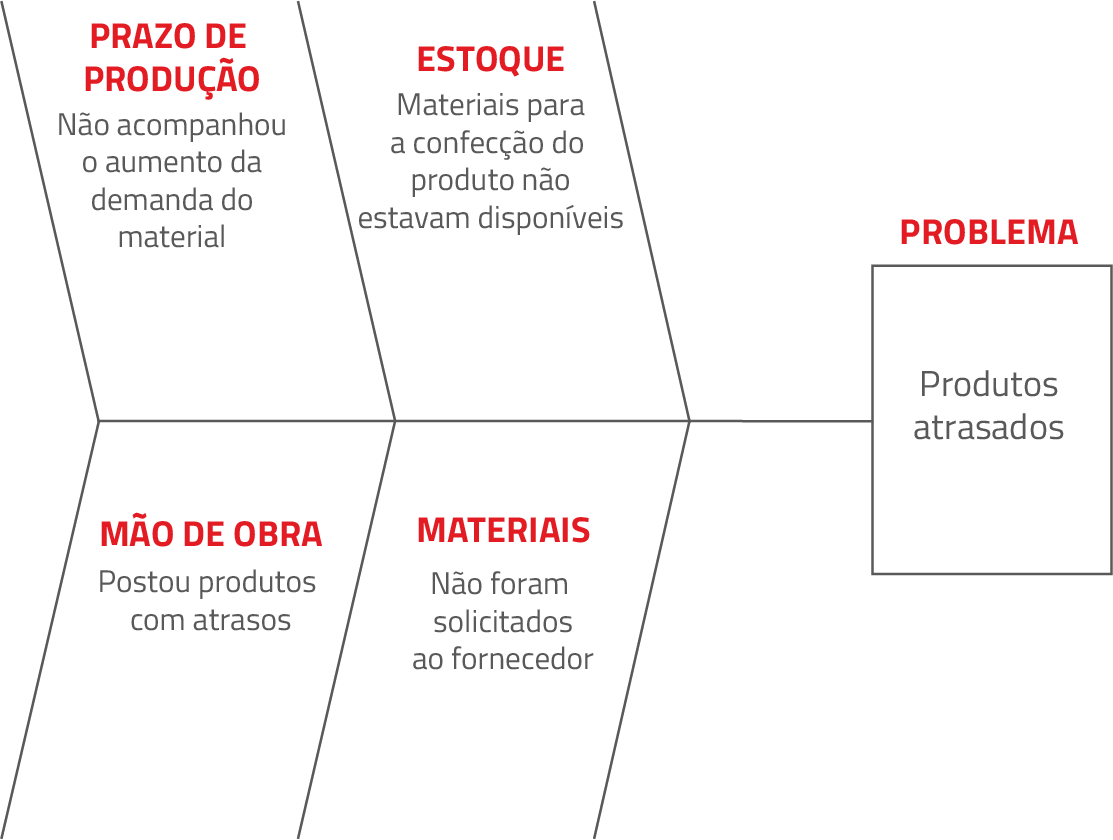
What are the 6 Ishikawa categories (the 6Ms)?
Another important detail for learning how to run the analysis with the Ishikawa diagram is to use the 6 categories defined by Ishikawa, known as the 6Ms:
- Method: how does the way the work is done affect the problem?
- Machine: how does the equipment used in the process influence the problem?
- Measurement: how do the metrics used to measure the progress of the activity influence the problem?
- Environment: how does the setting in which the activity takes place affect the problem?
- Material: how do the quality and type of the materials used affect the problem?
- Manpower: how do the people involved in the activity influence the problem?
Remember: these are only some of the possible categories to analyze with the help of the Ishikawa chart.

When you use the fishbone investigation method to pursue quality in your processes, you should define your own concepts, based on the specifics of your business.
In this root cause analysis tool, the problem is a way to identify processes that are not optimized and to establish a continuous improvement routine in the company.
3. 5 Whys investigation method
The 5 Whysopens in a new tab quality tool is the simplest of those presented, but no less effective. It starts from the principle of digging deeper into a question, trying to extract the deepest root cause of the problem.
It is widely used when you want to improve the quality of a business’s deliverables and continuously improve processes.
It was created in the 1950s by Taiichi Ohno, who worked at Toyota and saw the need to improve the quality of the company’s products to meet customers’ needs.
This root cause analysis method is carried out by asking why a given problem happens, five times in a row.
After 5 questions, on average, Ohno believed he had reached the true root cause of the challenge, and could take steps to eliminate it and create a process that would guarantee excellent deliveries.
Applying the 5 Whys quality tool is especially recommended for problems with few variables. When they become more complex, you need to evaluate other factors. At that point, this method is no longer enough.
4. Check Sheet
The check sheetopens in a new tab is another root cause analysis tool that is very popular in the business world. Basically, it is a form that standardizes how a company collects data, making deeper analyses easier.
Siteware prepared a 100% free check sheet template for you. Download it now:

This tool can be used in different scenarios, such as:
- identifying the root cause of a problem;
- making it easier to count items in stock or on a production line;
- keeping track of services;
- implementing a culture of continuous improvementopens in a new tab in the company.
See an example of a check sheet:
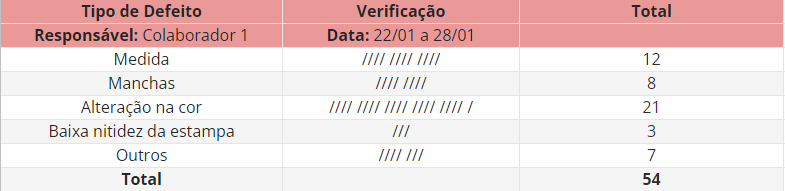
5. FCA
Fact, Cause and Action (FCA) is a systematic root cause analysis methodology used to trace the underlying causes of failures or problems, especially in contexts where precision and reliability are crucial, such as industry and engineering.
The process begins with a clear and detailed identification of the problem in question.
After the problem is identified, data collection comes into play. This step is essential because the quality and depth of the analysis depend heavily on the accuracy and scope of the data collected. The data can include operation records, maintenance records, sensor readings, incident reports and any other information that can shed light on the problem.
With the data in hand, a preliminary analysis follows.
This phase involves examining the information collected to identify patterns, anomalies or specific conditions that may be linked to the failure. From that analysis, a list of potential causes is generated. These are, essentially, hypotheses about what may have caused the problem.
Each potential cause is then put through a rigorous test to verify its validity. This can involve a variety of methods, from controlled experiments and simulations to deeper data analysis or reviews of technical literature. The goal is to confirm whether each potential cause could realistically lead to the observed problem.
Advantages of using root cause analysis tools
Implementing root cause analysis tools offers valuable advantages to any company. Some of them are better alignment of corporate goals among employees, a sharper focus on the reason for the problem, speed in solving challenges and standardization in evaluating causes and effects.
Here are the main benefits this practice offers to businesses:
- Alignment: the obstacles to reaching results are opened up for discussion with the whole team;
- Depth: because the analysis is never superficial, the team is more likely to focus on the real cause;
- Standardization: analyses follow the same execution script.
How do you prioritize the problems to solve?
To prioritize the problems to be solved after identifying and analyzing the root cause, you can use other tools, such as the decision prioritization matrix, known as the GUT matrixopens in a new tab. It is very simple and easy to use, and you should apply it whenever you have many problems to solve and do not know which one to start with.
The matrix, created by Charles Kepner and Benjamin Tregoe in 1981, is still very useful and current.
To use it, use the table below to give each problem a score, from zero to five, based on 3 criteria:
- severity of the problem;
- urgency of solving it;
- tendency of the problem to get worse.
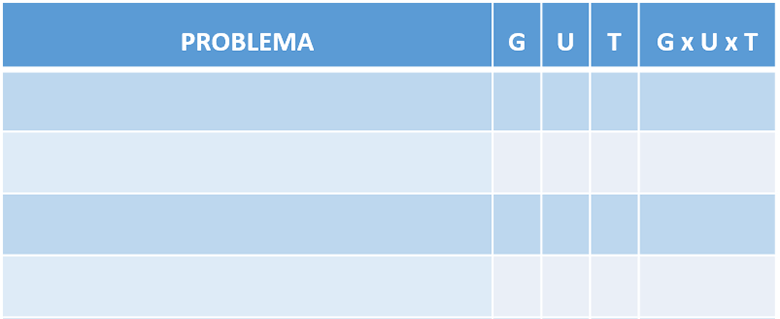
Here is each criterion of the decision-making matrix in more detail:
- Severity: for this concept, you need to define how much the consequences of the problem will affect the company’s strategic objectives and the safety of people and the community.
- Urgency: what happens if the problem is not solved immediately? Can it wait, or will operations stop? Is there a contingency plan? Consider these factors to define how fast the problem must be solved.
- Tendency: how likely is the problem to keep getting worse if it is not solved soon? Does it tend to make the company’s operation harder and harder?
How do you score each criterion of the GUT matrix?
Based on these criteria, assign scores on this scale from 1 to 5:
- Not urgent and not serious, causes no immediate damage.
- Slightly urgent, slightly serious, and it will get worse in the long term.
- Urgent and serious, and it will get worse in the medium term.
- Very urgent and also very serious, and it should get worse in a short time.
- Extremely urgent and equally serious. It must be solved before it gets worse.
Enter the scores in the decision matrix, multiply the numbers and find the result. The highest one corresponds to the problem that should be solved first.
What are the main challenges of running a root cause analysis?
- Telling symptoms from real causes: one of the biggest challenges is telling the symptoms of a problem apart from its real causes. Teams often focus on solving the immediate symptoms without addressing the underlying issues causing the problem.
- Complexity and interconnection of causes: some problems result from several interconnected causes, which can make it hard to identify all the fundamental causes. The complexity of systems and processes can obscure cause-and-effect relationships.
- Insufficient data and information: a lack of reliable or detailed data can prevent an accurate analysis. Without enough information, it can be hard to identify the real causes or validate hypotheses.
- Bias and assumptions: personal bias, incorrect assumptions and resistance to change can influence the analysis and lead to wrong conclusions. Teams may find it hard to question their own beliefs, or may avoid pointing out problems that reflect badly on their own practices.
- Lack of skills or knowledge: root cause analysis can require specific skills, such as critical thinking, technical knowledge and experience with analysis methodologies. A lack of these skills in the team can make it hard to run an effective analysis.
How do you get more from root cause analysis tools?
To get more from root cause analysis tools, you need technology. A great example is project management software, which brings together several corporate management systems, based on concrete, real-time data.
A business management system is ideal for viewing the status of your whole client portfolio, managing the company’s portfolio and monitoring deadlines and goals in schedules.
It does all of this through complete reports, with performance indicators centralized in one place. By regularly measuring the progress of results (or their decline), you can make decisions quickly and accurately to raise team performance.
In other words, this kind of system supports better use of root cause analysis tools, providing results and statistics that are essential for identifying bottlenecks in processes or in the activities the team carries out.
Get to know the Stratwsopens in a new tab software from Siteware, used by large companies, which makes planning, management and employee engagement easier and points every operation toward good results.
Transform how your company is managed with Stratws. Talk to an expert in continuous improvement:

About the author
Equipe Siteware
Content produced and reviewed by the Siteware team, curated by internal experts in strategic management and corporate performance.