
Management Methods
Pareto Chart: what it is, its benefits and how to use it
Learn what a Pareto chart is, how it works and how to use it to improve your business management, with a step-by-step guide to making one.

The Pareto Chart was first used in 1941. Since then, this tool has become a standout in the corporate world because it can identify cause-and-effect relationships, helping find the root cause of problemsopens in a new tab so they can be solved.
This is even more relevant because it is a statistical technique that, by identifying which processes can lead to the success of an undertaking, makes decision-making easier.
In this context, it has become one of the essential quality tools for leaders and managers focused on solving everyday pain points.
If you feel your company’s performance is not satisfactory, keep reading this article. You will find out:
- what a Pareto chart is;
- how this tool works;
- what it is for;
- when to use a Pareto chart;
- a step-by-step guide to making one for your business.
Keep reading and check it out!

What is a Pareto chart?
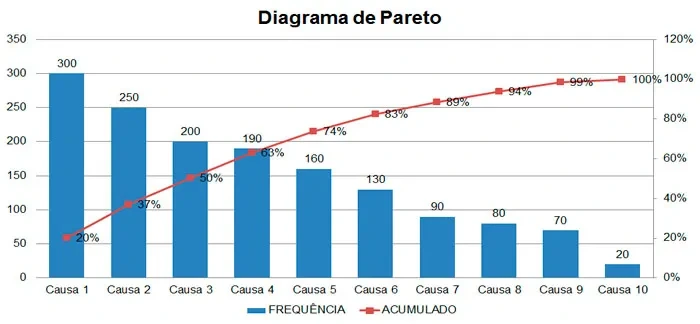
A Pareto chart is a tool that uses graphic resources to establish an 80/20 ratio in order to draw conclusions about the relationship between different situations.
The logic is that, normally, 80% of problems happen because of 20% of causes. In other words, if you solve your main headaches, 80% of the problems will be solved.
See these examples of the Pareto principle:
- 80% of customer complaints come from 20% of products/services;
- 80% of delivery delays come from 20% of the possible reasons for delays;
- 80% of company revenue comes from 20% of its workforce;
- 80% of your profit comes from 20% of your products or services;
- 80% of the total cost of your inventory comes from just 20% of products.
That is why the Pareto chart is a useful tool for decision-making and efficient resource allocation, since it helps direct effort to the most impactful causes, maximizing return on investment.
That is because leadership knows that investing in solving a problem that has been generating 80% of the issues will speed up and boost actions.
Also read:
- Track your company’s Action Plans simply!
- Goal tracking system: how to choose the best one for your company?
Who created the Pareto Chart?
Pareto Analysis came from an observation by the Italian economist Vilfredo Pareto in the early twentieth century. He concluded that 80% of Italy’s wealth came from just 20% of the population.
As he continued his research, Pareto found that this also happened in other countries. Following that logic, we can bring this analysis into the business world.
In the 1940s, Joseph Juran documented the chart and formally recognized it for the business world. This is how the principle came about, which also has other names, such as the “80/20 Principle” or the “Pareto Rule.”
What is the Pareto Chart for?
The main purpose of the 80/20 rule is to prioritize the demands that should be handled first in a given context.
By using a Pareto chart, your company can identify, for example, its main groups of internal problems, in order to create an action planopens in a new tab to solve them.
In addition, this tool considers the number of occurrences and their probability, as well as the magnitude of the impact of each problem / improvement point identified.
This way, by using this tool, your company can work in a smarter and more intuitive way, setting aside unfocused, low-impact actions.
As with any good strategy, it is important to keep a dialogue among everyone in the organization, because decisions should be made collectively.
It works in a similar way to the GUT Matrixopens in a new tab, which, through severity, urgency and tendency, helps you identify which problems should be prioritized.
When to use the Pareto chart in your company?
This tool should be used when you need to set the company’s priorities. That is, to identify what needs to be solved first and what can wait without causing major problems or losses, maximizing results through the most practical actions.
It can also be applied when you need to identify the frequency of certain occurrences, such as many customer complaints.
In this particular scenario, the tool helps you find the main causes and, from there, develop an action plan.
What are the benefits of the Pareto chart?
The main benefit of the 80/20 rule is identifying your business priorities.
That is why it is widely used in companies when they want to do quality control over products and services. But it is also essential for improving decision-making.
Keep in mind that when a manager has a complete picture of the problems they face and prioritizes solving them, it is much easier to avoid possible crises and create more accurate strategies.
When you know which actions lead to a given goal, effort focuses only on those actions and eliminates the “irrelevant” ones.
If a company’s main goal is, for example, to improve the relationship with its target audience in brand communication, not finding out who they are and what they are looking for can affect the number of sales.
Using this methodology, in this case, means segmenting the customer base. That is, listing who your customers are in the order in which they buy the most or contact your company the most and, from there, creating targeted actions for them.
In practice, this minimizes effort, helps improve brainstormingopens in a new tab and team interaction, reduces the resources invested in what is unnecessary and generates more profitable results.
How does the Pareto chart work in business management?
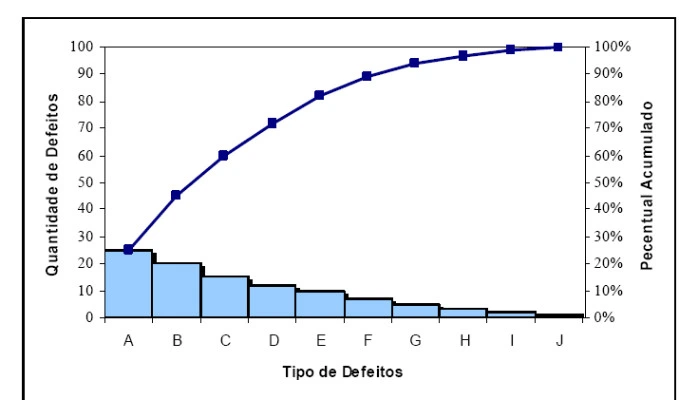
To understand how the Pareto chart works in your business management, it is important to know that there are two types of defects when we analyze the chart. They are: vital few and trivial many.
The vital few are related to a small group of problems that result in large, important losses.
On the other hand, there are the trivial many, which are in the group of many problems that cause small losses. The tool works to identify these two types and guide decision-making.
This way, one of the benefits of applying the chart in management is that the tool helps find these two groups. This helps create a priority order for solving them, through a GUT matrix, for example.
How to make a Pareto chart? A simple step-by-step guide
See how to make a Pareto chart in 5 very practical steps:
1. Define your goal
The first step in building the Pareto Chart is to clearly define your goal, that is, what you want to accomplish based on a fact.
You can choose this problem based on the frequency of occurrences, for example.
Some insights you can choose to help you solve different types of problems:
- Eliminate waste in a department;
- Reduce the business’s operating costs;
- Balance inventory levels;
- Minimize customer complaint rates;
- Improve the company’s organizational climate.
2. Collect the data
With the goal of your chart well defined, gather as much information and data about it as possible.
For example: if you are looking for the reasons behind an increase in customer complaints and cancellations, it is essential to list and gather all the information you have about it.
Then, run an analysis based on a given period.
Ideally, this period should not be too short, since that can distort the data. For that reason, it is recommended that it be at least four months, depending on the situation.
The logic is to collect all the data related to the action to help you build the chart.
3. Categorize the problems
Going back to the example just mentioned, which is finding the problems that generate customer complaints, it is important to separate the problems found by category, such as service failures and problems with the product/service itself.
This makes data analysis much faster and more accurate. It can help you conclude that 20% of a given complaint leads to 80% of all complaints received, for example.
4. Build a table with the data
After gathering all this information for your Pareto principle, you need to move it into a table.
Knowing this need, we are offering our readers exclusively a fully automated spreadsheetopens in a new tab (in Portuguese) to help build the analysis.
In this table, you should enter all the problems found, all their possible causesopens in a new tab and the cumulative percentage they represent. The next step is to sort the table in descending order.
Right after that, you need to add a column that gives the cumulative percentage of each occurrence.
5. Find the 20% that account for 80% of the results
With the data in hand and easily seen through the table (or a chart), just analyze how often each problem repeats. With that, you should measure what kind of impact it has on the company’s results.
The conclusions are so useful that, in the case under analysis, you can identify the type of customer who buys your product/service the most and the profile that complains the most.
With this kind of information it is possible to planopens in a new tab and intervention strategies, seeking to minimize the factors that influence these complaints.
In addition, for example, when you find out which audience accounts for 80% of your sales, you have valuable, strategic information in hand.
If you still have any questions, watch the video below to see how to use this tool in practice (in Portuguese):
What comes after you identify the logic of the problems?
After identifying the main cause generating most of the problems in a business context, using the Pareto Chart, the next step is to develop and implement an effective problem-solving strategy.
The 5 whysopens in a new tab tool, for example, will help you get to the root cause of that specific problem, and that will let your team work on a problem and not a symptom.
When you determine that your customers’ complaints happen because customer service has long wait times, you can look to increase the number of agents, for example.
Then, use brainstorming with your team to develop potential solutions for the main cause.
Consider creative, out-of-the-box solutions, but also be pragmatic about what is feasible within the company’s resource limits.
With other tools, such as the GUT Matrixopens in a new tab, prioritize the best solutions for solving your problem.
Afterward, develop a detailed action planopens in a new tab to implement the chosen solution. Define clear goals, deadlines, responsibilities and the resources needed.
Make sure the plan is realistic and has clear milestones for monitoring progress.

Limitations and precautions when using the Pareto Chart
The Pareto Chart is a robust tool for identifying and prioritizing problems but, like any tool, it has limitations.
When adopting it in decision-making processes, it is essential to be aware of its potential challenges and proceed with caution. Here are some limitations and precautions associated with it:
- Generalization of the 80/20 rule: while the famous 80/20 rule is a good starting point, it is a generalization. In some situations, the distribution may be 70/30, 90/10 or another combination. It is crucial not to cling rigidly to this ratio, but to focus on the main idea that a minority of causes can lead to the majority of problems.
- Neglecting “small” problems: just because something is not at the top of the Pareto Chart does not mean it should be completely ignored. Some “minor” causes may be symptoms of larger underlying problems or may grow in significance over time.
- Overreliance on past data: the Pareto Chart is based on historical data. While this data provides valuable information, it cannot always predict future trends or emerging changes in the business environment.
- Superficial interpretation: simply identifying the main causes of a problem is not enough. Managers must dig deeper to understand why these causes occur and how they can truly be resolved.
- Using it in isolation from other tools: the Pareto Chart is even more effective when used together with other analysis tools, such as the Ishikawa Diagramopens in a new tab. Using it in isolation can lead to a one-sided view of problems.
- Failure to update: business environments are dynamic. Problems and their causes can change over time. Therefore, it is vital to revisit and update the Pareto Chart regularly.
Integrating the Pareto Chart with other quality tools
The Pareto Chart, on its own, is powerful for identifying and prioritizing problems. However, its effectiveness increases when combined with other quality tools.
Let’s explore how the Ishikawa Diagram and the PDCA Cycleopens in a new tab fit together with the Pareto Chart:
1- Pareto Chart and Ishikawa Diagram:
After using the Pareto Chart to identify the main problems, the Ishikawa Diagramopens in a new tab can be used to investigate their root causes. This diagram, with its fishbone structure, helps categorize and detail possible causes of a specific problem.
The Pareto Chart highlights “what” needs attention, while the Ishikawa Diagram investigates “why” the problem occurs, providing a deeper understanding of the issues.

2- Pareto Chart and PDCA Cycle:
The PDCA cycleopens in a new tab, also known as the Deming cycle, is a continuous improvement methodology that involves four sequential steps: Plan, Do, Check and Act.
Each step plays a crucial role in identifying and solving problems, as well as in implementing improvements.
At the beginning of the PDCA cycle, in the Plan phase, the company should collect data on the problem it wants to solve. This data can include customer complaints, product defects, process delays, among others.
With this information in hand, the company can use the Pareto chart to categorize and prioritize these causes. In this case, the Pareto chart helps identify which causes contribute most to the problem, allowing the company to focus its efforts on the main causes, which account for most of the impact.

Next steps
As you can see, the step-by-step process of making a Pareto chart is quite simple. Although the theory may seem complex, you do not need great skills and knowledge to put it into practice.
This gets even simpler when you have a strategic planning system application, which helps increase, engage and boost your results, with visual resources that improve the company’s strategic deployment.
With this business management system, you track corporate performance and monitor and centralize all indicators, with a focus on decision-making.
So, if you are looking for software that has all these features and also helps with applying the Pareto principle, you need to get to know Stratwsopens in a new tab. It allows managers to organize.

Frequently asked questions
What is the Pareto Chart?
The Pareto Chart is a graphic tool that helps identify which causes are responsible for most of the problems or results in a given context. It is based on the idea that, in general, a minority of causes (about 20%) account for most of the effects (about 80%), allowing managers to focus where there is more impact.
What is the 80/20 Rule in the Pareto Chart?
It states that 80% of effects come from 20% of causes. In a business context, this can mean, for example, that 80% of complaints come from 20% of products, or that 80% of profit comes from 20% of services.
Who created the Pareto Chart?
The theoretical basis came from the Italian economist Vilfredo Pareto, in the early twentieth century, when he observed that most of Italy's wealth was concentrated in a minority of the population. Decades later, in the 1940s, Joseph Juran brought this principle into the world of quality and management, structuring the use of the chart and popularizing the expression “80/20 Principle” or “Pareto Rule.”
When to use the Pareto Chart in a company?
- Set priorities among several existing problems;- Understand which causes account for most of the occurrences (for example, customer complaints);- Decide where to focus resources and improvement actions to generate more results with less effort.

About the author
Equipe Siteware
Content produced and reviewed by the Siteware team, curated by internal experts in strategic management and corporate performance.