
Management Methods
Everything you need to know about Pareto analysis
Find out how Pareto analysis can help you manage problems, learn the step-by-step to apply it, and use a free template to build your chart.

Have you ever wondered why some problems seem to have a disproportionate impact on your business results? Imagine if you could magically identify those few critical problems that, once solved, give the biggest return on the effort invested. Well, then we need to talk about Pareto Analysis.
Also known as the 80/20 principle, Pareto Analysis is a statistical tool used to identify the most significant causes of a problem, allowing managers and teams to focus their efforts on the areas that will have the greatest impact.
If you want to know more about it, keep reading, because here I explain everything!

What is Pareto Analysis?
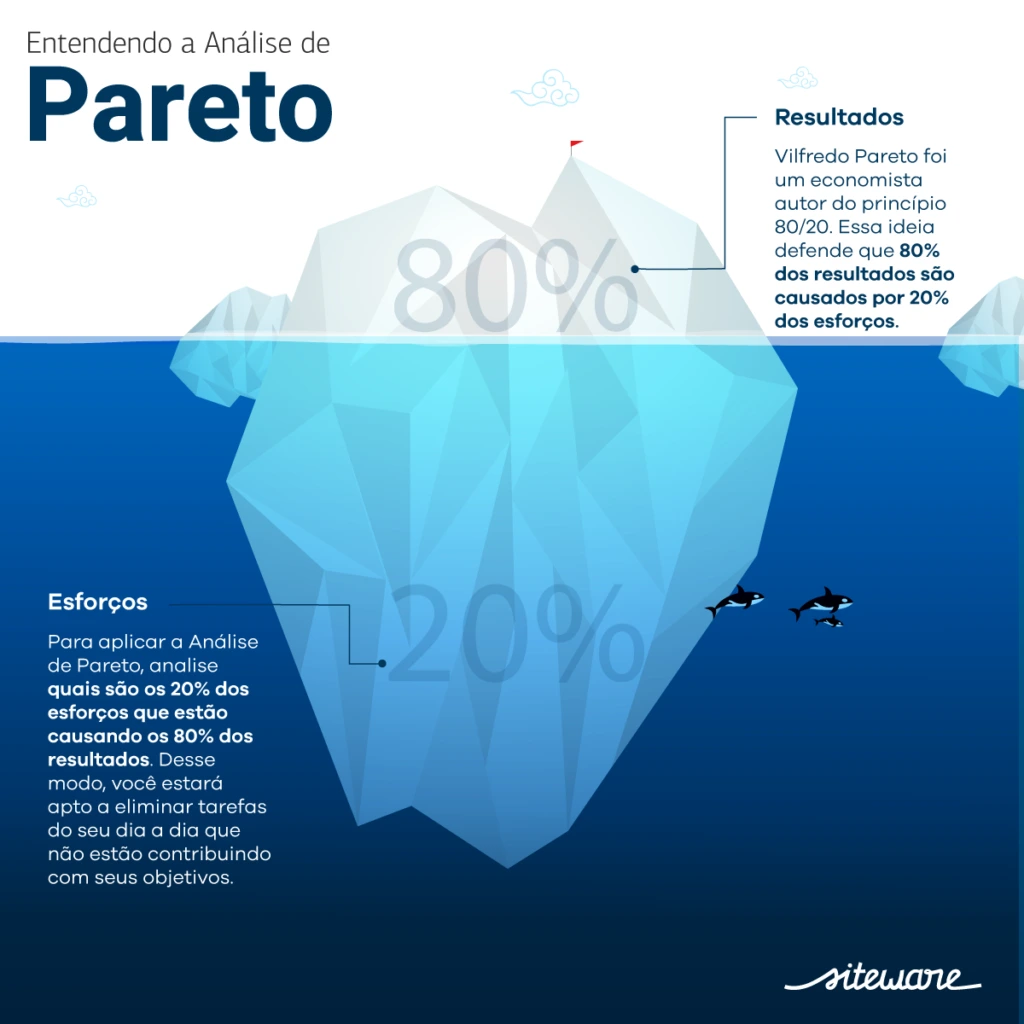
Also known as the 80/20 Rule, the ABC Curve or the Pareto Chartopens in a new tab, Pareto Analysis is a scheme, usually in the form of a column chart, that groups and orders the frequency of certain occurrences. It is all based on a very simple idea: that 80% of the consequences come from 20% of the causes.
The name honors the Italian economist Vilfredo Pareto. He found that 80% of the economy was held by only 20% of the population. And that was what generated the country’s main economic problems.
In Pareto analysis, it is common to worry about unimportant problems. This method, in turn, aims to show that people can spend their time and energy on truly serious issues.
The same goes for the work done. Instead of spending hours on repetitive activities, you can focus on specific, more strategic actions that will generate most of the results.
When a company has difficulty retaining customers, it is common to turn to new marketing strategies or product updates. But the solution may be much simpler! An unprepared customer service department, for example.
The greatest use of Pareto analysis is that it makes it easy to identify what is really harmful at the professional, personal and organizational level. List the points in order of importance and concentrate efforts on a more effective resolution.
How to use Pareto Analysis in your company?
Pareto analysis is very practical to use and can be done more easily with the help of software that has a set of spreadsheets, tables and charts.
First of all, it is important to remember that the percentages that give Pareto Analysis its name are only figurative. Not every company will have these numbers in practice. They only serve to show the discrepancy between problems or work done versus results obtained.
Step 1: Identify the problems or causes
First, collect relevant data. List all the problems, defects or causes you want to analyze. Imagine yourself as a detective, collecting clues and evidence to solve a big mystery. Be specific and detailed, noting each occurrence or relevant factor.
Step 2: Quantify the problems
Next, quantify each problem or cause. This can be done by counting how often each problem occurs or by measuring the financial impact of each cause. Think of it as weighing the ingredients of a recipe; every gram counts toward the final result.
Step 3: Rank the causes
Now, organize your data. Rank the problems from most significant to least significant. You are creating a hierarchy of importance, where the biggest villains sit at the top of the list. This step is crucial to focus your efforts on the areas that really matter.
Step 4: Create the Pareto chart
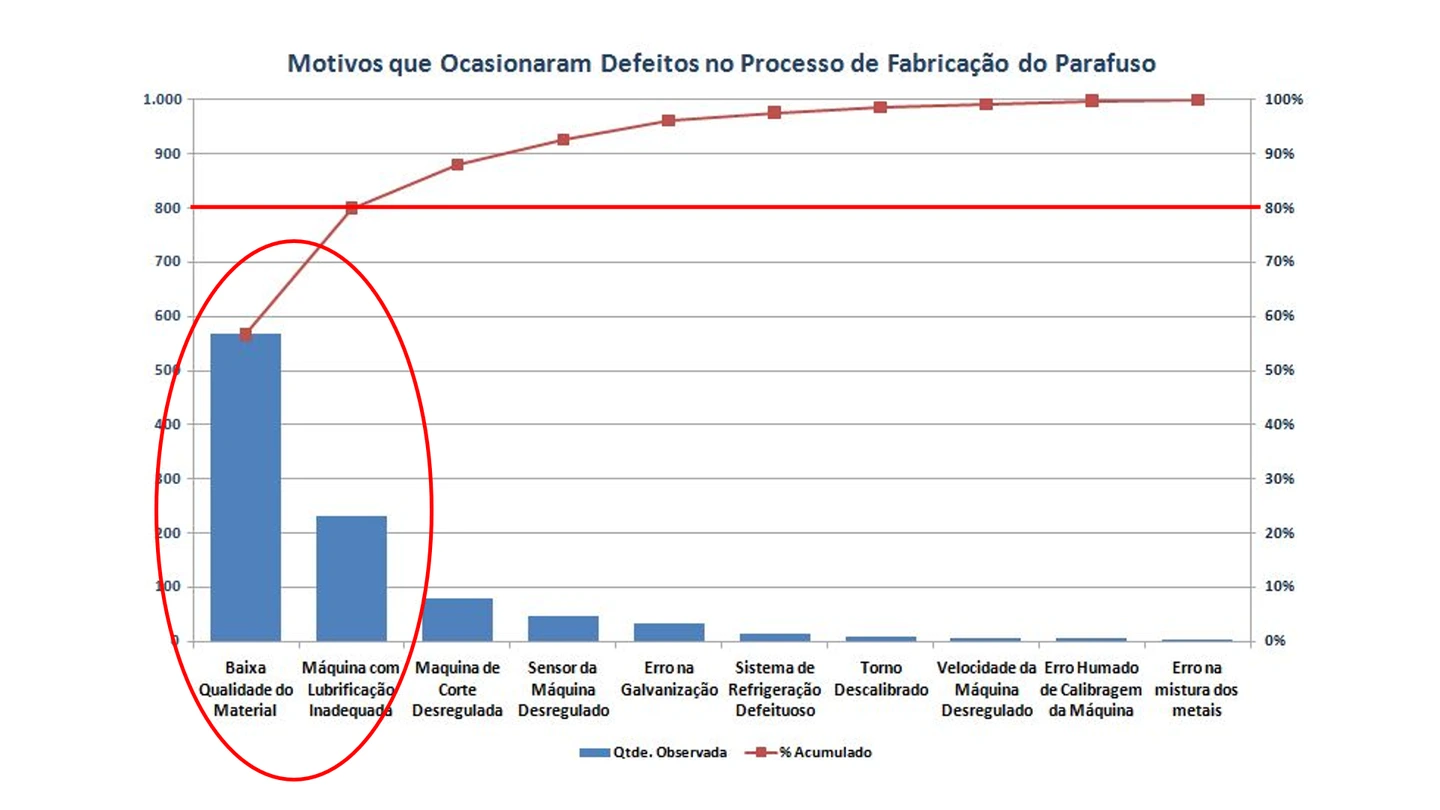
With the data organized, it is time to visualize. Use a bar chart to represent your causes, with the bars ordered from greatest to least impact. Imagine a podium where the biggest problems are on the highest spot. Add a cumulative curve line to show the percentage sum of the causes. This helps visualize the famous 80/20 rule.
If you prefer, download our template (in Portuguese)opens in a new tab to streamline building this chart.
Step 5: Analyze and prioritize
Interpret the chart with a critical eye. Identify which problems or causes make up most of the total impact. These are the 20% of problems that cause 80% of the effects. This is your battlefield; this is where your efforts will bring the greatest return.
Step 6: Act and monitor
Finally, take action based on your findings. Develop an action planopens in a new tab focused on the most critical problems. Remember to continuously monitor progress and adjust your strategies as needed. Pareto analysis is not a one-time event, but a continuous improvement process.
What are the benefits of the analysis?
The Pareto Principle is widely used in companies when they want to run quality control on products and services. But it is also very important for improving decision-making.
When a manager has a complete picture of their problems and prioritizes solving them, it is much easier to avoid possible crises and create more accurate strategies. When you know which actions lead to a given goal, effort concentrates only on those actions and eliminates the irrelevant ones.
If a company’s biggest goal is, for example, to improve its relationship with its target audience in brand communication, not finding out who they are and what they are looking for can affect the number of sales.
Using this methodology, in that case, will consist of segmenting the customer base. That is, listing who your customers are in the order in which they buy the most or contact your company the most and, from there, creating actions aimed at them.
In practice, this minimizes effort, helps improve brainstormingopens in a new tab and team interaction, reduces the amount of resources invested in what is unnecessary and generates more profitable results.
Next steps
Using this strategy may seem like a waste of time at first glance. But with it, you can see more clearly the frequency of both negative and positive episodes. That way, it is easier to share them with the whole team.
Having this awareness is important to measure the real impact of problems and causes. And from there, to understand how they affect your business, and then improve most of the results (the 80%). To ensure the efficiency of Pareto Analysis, gather data effectively, without relying on assumptions, and make sure all your employees take part in it!
And you, did you already know Pareto Analysis? Do you think this technique can make a difference for your company?
With Stratws, Siteware’s business management software, you have access to the Improvement Opportunities module, which includes a fully customizable Pareto Chart for you to use!
Frequently asked questions
What is Pareto Analysis?
Pareto analysis is a prioritization technique based on the Pareto Principle, or 80/20 rule, which states that, in many cases, 80% of the effects come from 20% of the causes. This analysis helps companies identify the most relevant factors to focus effort on and get better results.
How to do a Pareto analysis step by step?
1. List the problems or causes related to the topic being analyzed;2. Collect quantitative data on each cause (frequency, impact, cost, etc.);3. Rank them in descending order of importance or occurrence;4. Calculate the cumulative percentage to identify the 20% cutoff point;5. Build the Pareto chart, which combines bars (values) and a cumulative line (percentages);6. Define action priorities based on the most relevant causes;7. Relying on management software like Stratws makes it easier to track strategic indicators and apply the analysis, since it lets you build a Pareto Chart customizable for each reality.
What are the benefits of Pareto analysis?
1. Helps define priorities clearly;2. Improves the focus of the team's efforts;3. Reduces waste of time and resources;4. Makes data-based decision-making easier;5. Supports continuous improvement and problem solving.

About the author
Equipe Siteware
Content produced and reviewed by the Siteware team, curated by internal experts in strategic management and corporate performance.