
Continuous Improvement
What Is the DMAIC Cycle and How Do You Use It?
Learn what DMAIC is, what its phases are and how to use this method, one of the most widely used quality management tools in companies.
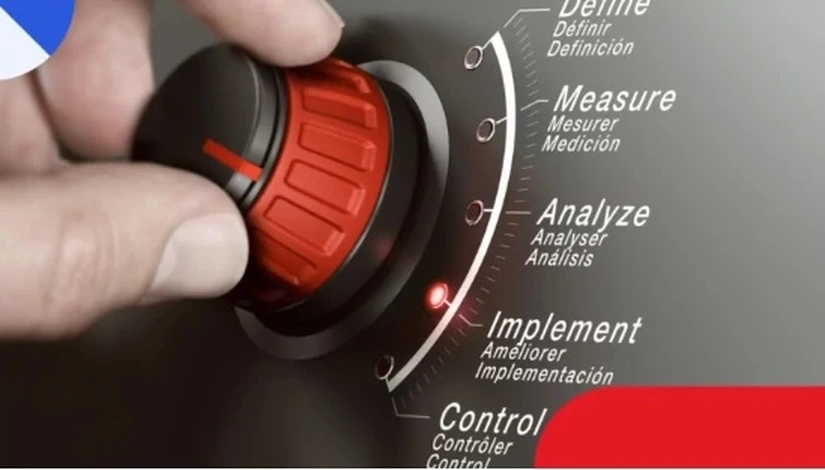
Imagine running a large company and suddenly facing a problem that seems impossible to solve. Costs are high, productivity is low and nobody knows exactly where the error is. What would you do? In this challenging scenario, the DMAIC cycle stands out as a true hero of process improvement.
That is because it reduces waste, limits failures, solves problems, improves processes and gives a broader, more detailed view of everything that happens inside the organization, giving the team greater control over these activities.
With the DMAIC tool, strategic planningopens in a new tab can be developed in a quantitative and organized way, making it more efficient.
Want to know once and for all what the DMAIC cycle is, in a simple and practical way? Then keep reading!
Siteware prepared a 100% free, complete DMAIC cycle resource for you. Download it now:

You may also be interested in:
- BSC software: 5 essential features + tool tips
- Management tracking system: 12 essential characteristics
What is DMAIC?
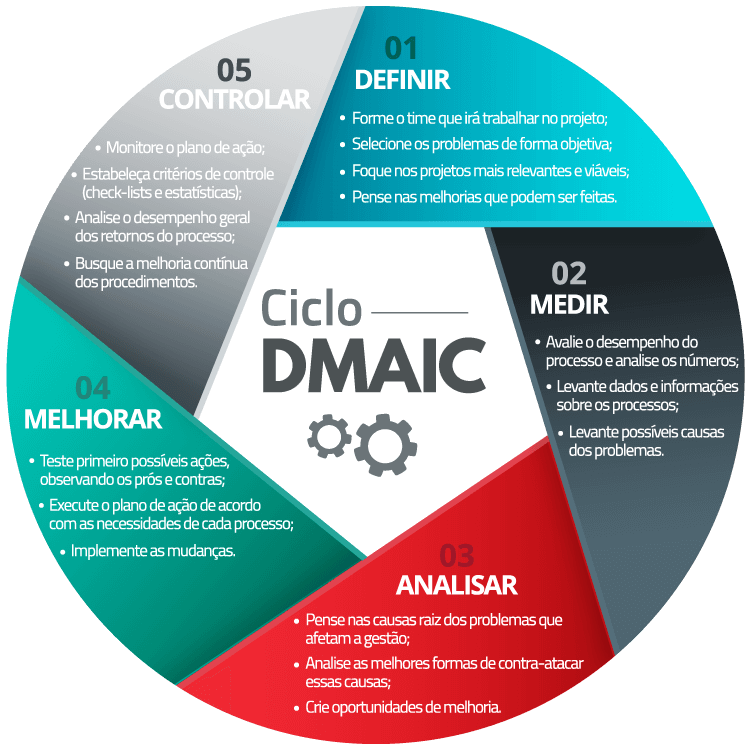
The DMAIC cycle is a process management methodology used mainly to improve quality and efficiency in an organization. It is an acronym for the five phases of the process: Define, Measure, Analyze, Improve and Control.
The DMAIC cycle is therefore a core part of the Six Sigma methodology, but it can also be applied independently of it. It is a systematic, data-driven approach to problem solving and process improvement, widely used across many industries and types of organizations.
- Define: this phase involves clearly defining the problem or the project goal. It includes identifying customer needs and defining the project scope.
- Measure: in this phase, relevant data is collected to understand the current performance of the process. This can include cycle times, defect rates, costs and so on.
- Analyze: here, the goal is to identify the root causes of the problems or inefficiencies in the current process. This usually involves data analysis, brainstorming and other problem analysis techniques.
- Improve: in this phase, solutions to the identified problems are developed and tested. This can involve process optimization, design changes, employee training and more.
- Control: after the improvements are implemented, the process is monitored continuously to make sure the changes are sustainable and the benefits are kept.
The four stages of the DMAIC cycle
Now that you understand what the DMAIC methodology is, let’s look more closely at the stages that are part of it. Check them out.
Stage 1 of the DMAIC cycle: Define
The “Define” stage is the foundation of the whole DMAIC process. Without a clear and precise definition of the problem, the following stages can lose focus and end up with ineffective solutions.
So the first step is to clearly identify the problem or the improvement opportunity. This involves a detailed description of the issue that is hurting the performance of the process or the organization. Ask yourself:
- What specific problem are we facing?
- Where and when does this problem occur?
- What are the negative effects of this problem?
In this stage, brainstorming and an analysis of the company’s KPIs can be used.
Once the problem is identified, it is essential to define the project scope. The scope determines which parts of the organization or process will be analyzed and which will not. This helps keep focus and manage expectations. To define the scope:
- Delimit the areas affected by the problem.
- Set clear boundaries (what is included and what is outside the project).
- Determine the available resources (time, team, budget).
Several techniques, tools and methodologies can be used to make sure this phase is effective and well grounded, such as:
1- Project Charter
The project charter is a document that defines the project’s scope, objectives, duration and stakeholdersopens in a new tab. It includes crucial information such as the project’s justification, the required resources, the key people involved and the success metrics.
In the DMAIC cycle, it works as a contract between the project team and the organization, making sure all participants are aligned and understand the project’s goals and limits.
2- Voice of the Customer (VOC)
VOC is a process for capturing customer requirements and feedback to understand their expectations and needs. It provides direct customer insights that are essential to focus the project on improvements that will bring real value to the customer.
3- SIPOC (Suppliers, Inputs, Process, Outputs, and Customers)
The SIPOC matrix is a diagram that summarizes the suppliers, inputs, processes, outputs and customers of a process. This high-level diagram helps the project team understand the current process and identify the key elements that will be analyzed and improved.
4- Kano Model
A tool used to analyze and classify customer needs into three categories: basic, performance and delight.
It helps tell apart the features that are essential for customer satisfaction from those that can increase satisfaction or even surprise the customer, directly influencing the project’s priorities.
Stage 2 of the DMAIC cycle: Measure
The second stage of the DMAIC cycle is measuring. Here, you will need to analyze the performance of the chosen process before applying improvements. This makes it possible to compare results after they are implemented.
At the same time, the team will need to study the current state of the business in great detail to identify mistakes and successes, including:
- evaluating process performance and analyzing it quantitatively before taking action (so that performance can be compared before and after);
- collecting data and information about the processes;
- listing the possible causes of the problems.
To complement this, some methods can be used in this stage, such as the Ishikawa Diagram (Fishbone), Pareto Analysis and matrices (such as Cause and Effect, GUT or RAB). Let’s talk about them.
1- Ishikawa Diagram
The Ishikawa Diagramopens in a new tab, also known as the Fishbone Diagram or Cause and Effect Diagram, is a visual tool used to identify, explore and display the possible causes of a specific problem.
The structure of the Ishikawa Diagram is similar to the backbone of a fish, hence the name “Fishbone Diagram.” On the right side of the diagram, the problem (or effect) that needs to be solved is placed. From there, long lines that look like bones are drawn pointing to the problem. Each of these “bones” represents a main category of potential causes.

2- Pareto Analysis
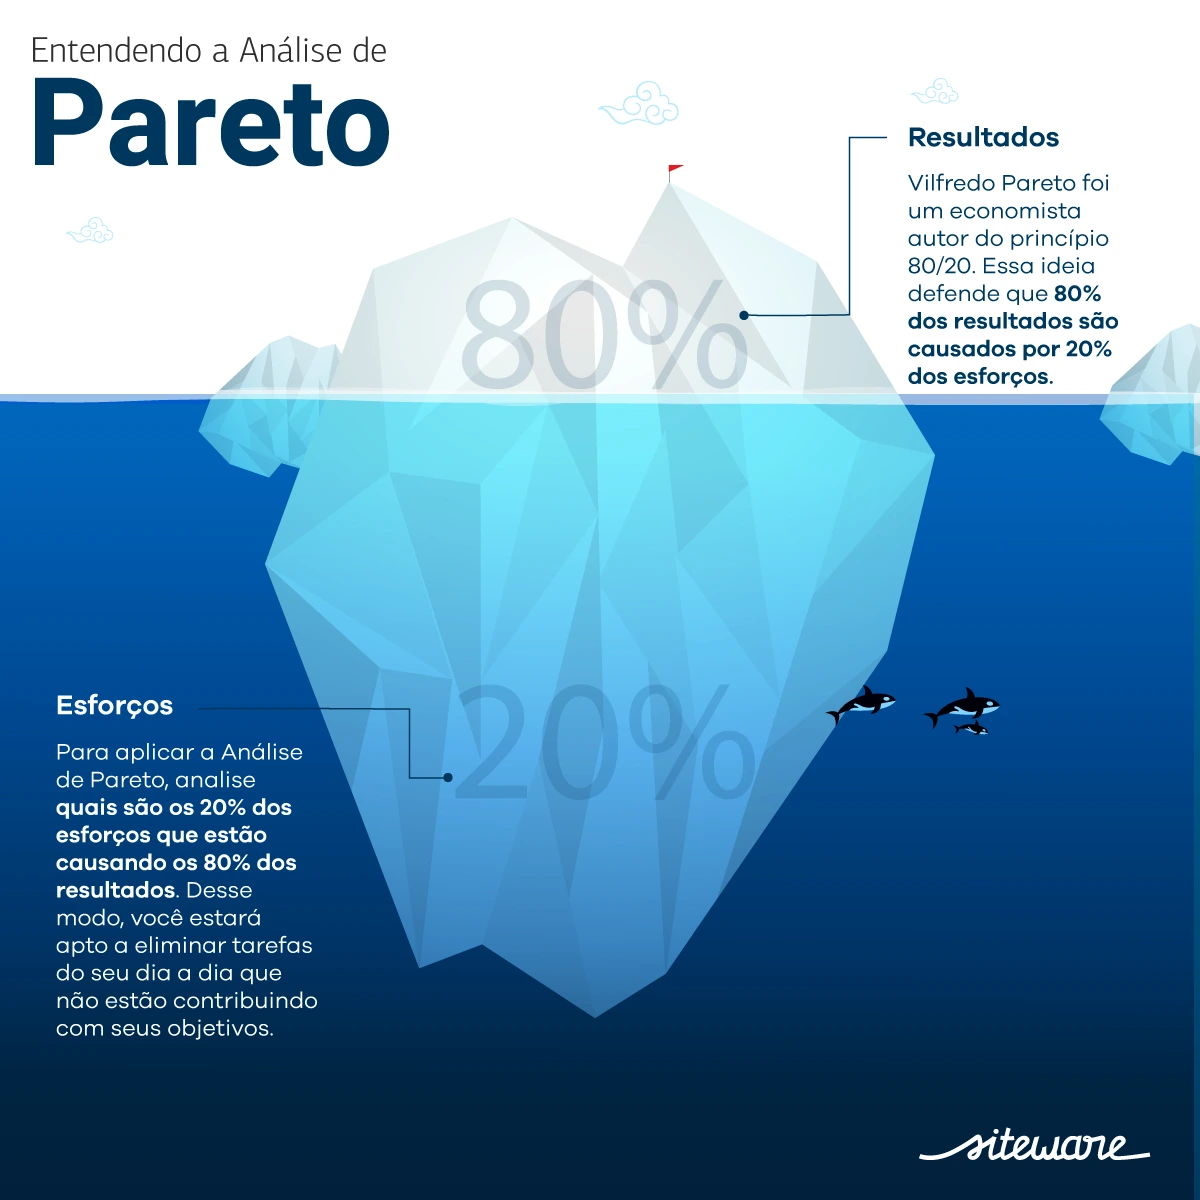
Pareto Analysisopens in a new tab, also known as the 80/20 rule, is a statistical technique used to identify the most significant causes of a given problem.
It is based on the principle set out by the Italian economist Vilfredo Pareto, who observed that 80% of effects are often caused by 20% of causes. Although the exact percentages may vary, the central idea is that most problems result from a relatively small number of causes.
3- Cause and Effect Matrix and GUT
The GUT Matrixopens in a new tab is a management tool used to prioritize problems or opportunities and make more effective decisions. GUT stands for Gravity, Urgency and Tendency, which are the criteria used to evaluate and rank problems.
This tool is particularly useful when there are many problems to solve or many opportunities to explore, and you need to decide where to start.
- Gravity: refers to the impact or consequences of the problem if it is not solved. Problems with serious or far-reaching consequences get a higher gravity score.
- Urgency: relates to time. It considers how quickly action is needed to solve the problem. Problems that require immediate action get a higher urgency score.
- Tendency: assesses how the problem will evolve over time if it is not addressed. A problem that will get worse quickly gets a higher tendency score.
4- Histograms
Histograms are a statistical and graphical tool used to represent the frequency distribution of a data set. They are particularly useful for understanding the shape, spread and center of the data, making it easier to analyze and interpret large sets of information.
A histogram is a type of bar chart, but unlike an ordinary bar chart, it is used to represent continuous data, where the bars are adjacent, with no gaps between them.
5- Process map
A process map is a graphic representation of all the activities that make up a process inside an organization.
In this case, all relationships are made clear, showing who is responsible for each activity, from inputs to outputs.
Learn more: What is a Reasoning Map and how do you make one?opens in a new tab (in Portuguese)
Stage 3 of the DMAIC cycle: Analyze
After analyzing the performance of the chosen process with one of the tools presented earlier, this is the moment to formulate actions to address the points raised in the first stage, Define.
It is therefore the phase in which you assess the improvements needed to solve the cause of the problem.
In short, you need to:
- think about the root causes of the problems that affect management;
- analyze the best ways to counter those causes;
- create improvement opportunities.
In this stage, the 5 Whysopens in a new tab method can be used to identify root causes. Besides it, there are other methods, such as FMEA, Scatter Diagram and Hypothesis Testing.
1- 5 Whys
This is a method used to identify the root cause of a problem. The idea is to keep digging deeper with “why” until you reach the cause.
It does not necessarily mean exactly 5 whys. There can be more or fewer, depending on the problem. After all, you can reach the cause faster or slower.
2- FMEA
FMEAopens in a new tab is a methodology known as Failure Mode and Effects Analysis. It is a tool that aims to find failures before a part or product is made.
It helps the manager determine the reliability of the design, that is, find out what is causing a problem.
3- Scatter Diagram
This is a type of quality tool that aims to analyze the relationship between two quantitative variables through a graphic representation.
4- Hypothesis Testing
Hypothesis testing is a method in which you can accept or reject a claim about a given population.
Everything is derived from the data provided by a data sample.
Stage 4 of the DMAIC cycle: Improve
The fourth stage is where you roll up your sleeves. That is, this is where the points analyzed in the previous stage will be improved.
At this point, the team will test the likely actions, always weighing pros and cons. The fourth stage is also where the action plan for the changes is put into practice, which includes:
- testing possible actions in advance, considering their positive and negative points;
- executing the action plan according to the specific needs of each process;
- implementing the changes.
As a complement, the 5W2Hopens in a new tab method can be used, since it helps identify several possible actions so they can be tested. They can be set as future steps, respecting priorities.
It is important to highlight that the implemented changes need to be monitored to track how the process runs.
In the “Improve” phase of the DMAIC cycle, the focus is to develop, test and implement solutions that address the root causes of the problems identified in the previous stages. Some tools used in this stage include:
1- Design of Experiments (DoE)
DoE is a statistical technique used to plan, run, analyze and interpret controlled experiments. The goal is to identify the relationships that affect the results of an output variable. In the DMAIC cycle, it is very effective for optimizing products and processes, since it lets you test the effects of several input variables at the same time.
2- Kaizen
An approach focused on continuous improvement, carried out through rapid improvement events or more gradual continuous improvement activities. In this way, it fosters a culture of continuous innovationopens in a new tab and incremental improvement, which can support the implementation of solutions identified during the “Improve” phase.
Stage 5 of the DMAIC cycle: Control
The last stage of the DMAIC methodology is control, to make sure that actions are being monitored and going through continuous improvement.
In this phase, the performance and results achieved through the execution of the action plans will be monitored.
It is worth noting that, in this phase, the company’s procedures need to be updated so that continuous improvement takes place, according to the implementations and changes that need to be made.
In this phase:
- monitor the progress of the action plan so it does not get lost;
- set control criteria (checklists, statistics and so on);
- analyze the overall performance of the process returns (financial or not);
- update procedures for continuous improvement, according to needs as they arise.
At the same time, Control Charts and OCAPopens in a new tab methods can be used.
Where can DMAIC be used?
The DMAIC cycle is an extremely flexible and adaptable tool that can be applied in a wide range of business contexts, regardless of the size or sector of the company.
In manufacturing companies, DMAIC is often used to optimize production processes, reduce defects, minimize waste and improve product quality. These improvements not only increase operational efficiency but also contribute to greater customer satisfaction and lower costs.
In the services sector, the DMAIC cycle proves just as valuable. Whether in financial institutions, hospitals, hotels or technology companies, it can be used to improve customer service processes, operations management and internal services.
For example, in a hospital, DMAIC can help reduce patient wait times and improve the quality of care.
Small and midsize companies can also benefit from DMAIC. Even with limited resources, these companies can use DMAIC to identify and eliminate process inefficiencies, improve inventory management, optimize day-to-day operations and increase customer satisfaction.
This is particularly important for small businesses seeking to establish themselves and grow in competitive markets.
What are the main goals of the DMAIC methodology?
Among the main goals of the DMAIC methodology are improving processes, boosting the company’s quality management and improving activities and products. Basically, the method helps the company reach success much more easily.
Another point worth noting is that you will be able to deliver better and better services to consumers, making the most of the available resources.
This method shares uses and procedures with some we have already covered on the blog, such as the PDCA cycleopens in a new tab and others.
Each of these methodologies can be used on its own or as a complement to the others, depending on the organization’s goal and its particularities.
What is the difference between PDCA and DMAIC?
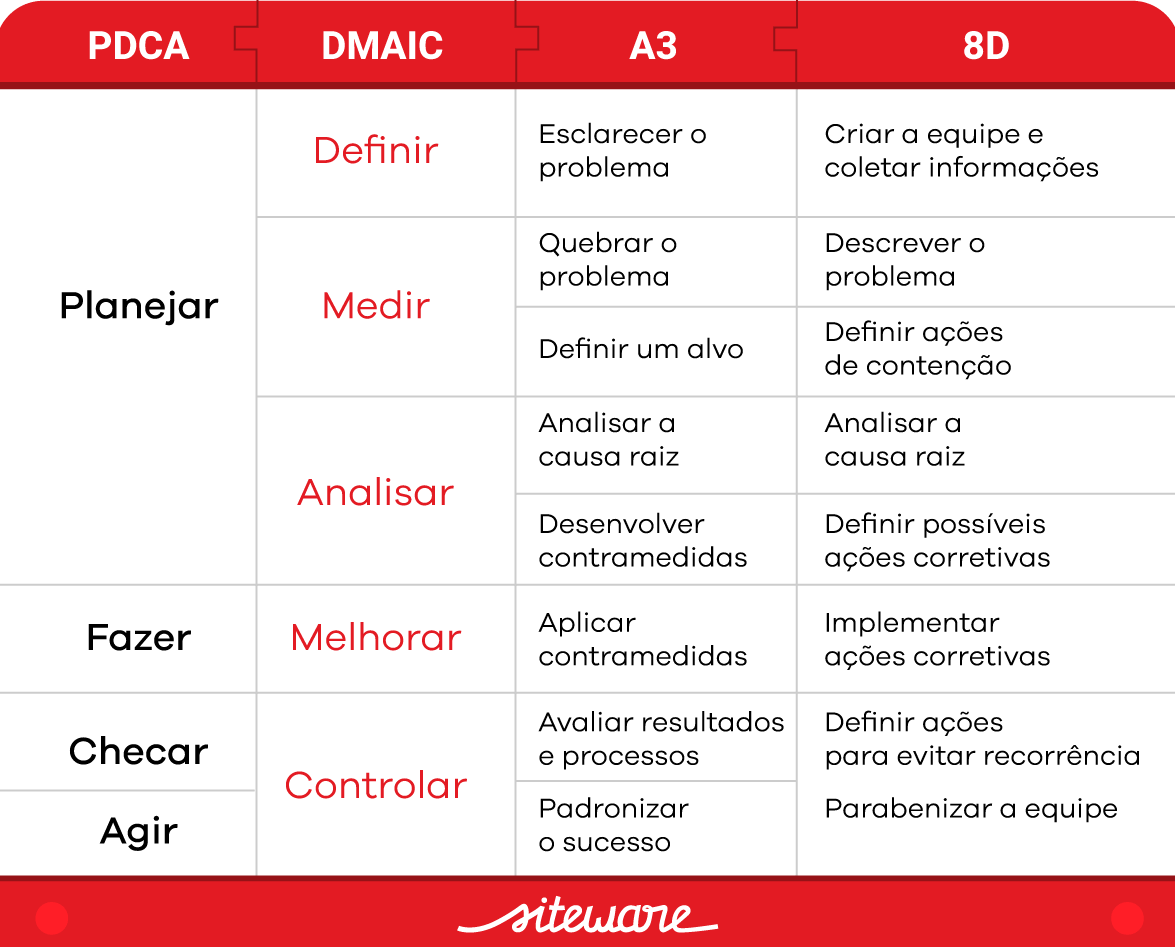
PDCA and DMAIC are continuous improvement methods widely used in process and quality management. Both methods are cyclical and focus on optimizing processes and eliminating defects or inefficiencies. However, they have different origins, applications and nuances that are important to understand in order to choose the most suitable tool for each situation.
PDCA, being a more generic method, is flexible and can be used in any type of process or sector for continuous improvement. It is ideal for situations where the solution may not be known and needs to be discovered by trial and error.
On the other hand, as part of Six Sigma, DMAIC is more often used in contexts where quality and precision are critical, and problems are complex and need a detailed analytical approach. It is particularly valuable in industries such as manufacturing, engineering and any area that benefits from reducing variability and defects.
So, although both PDCA and DMAIC are designed to improve processes through an iterative cycle of activities, their differences lie in their specific approaches, level of detail and context of application. The choice between PDCA and DMAIC will depend on the project’s specific goals, the complexity of the problems faced and the organization’s operating environment.

Methodology comparison chart: understand each one!
What are the advantages of the DMAIC method?
The DMAIC cycle offers several significant advantages that can benefit your company in different ways. Among them, these stand out:
1. Data-driven approach
The DMAIC cycle emphasizes the collection and analysis of data, which means decisions and improvements are based on concrete evidence, not on assumptions or intuition. This increases the likelihood that improvement initiatives will succeed.
2. Better quality and efficiency
By identifying and addressing the root causes of problems, DMAIC helps reduce errors and defects in processes, leading to higher product or service quality.
The methodology also helps identify inefficiencies in existing processes and implement solutions to optimize them, resulting in greater operational efficiency.
3. Higher customer satisfaction
The DMAIC cycle starts with a clear definition of customer needs and expectations, making sure the improvements implemented are aligned with what matters most to customers.
The methodology promotes a culture of continuous improvement, which can lead to a steady increase in customer satisfaction over time.
4. Cost reduction
By making processes more efficient and reducing errors and defects, the DMAIC cycle can help cut waste, resulting in cost savings.
The methodology promotes a more efficient use of resources, both material and human, which can lead to a significant reduction in operating costs.
Next steps
For the DMAIC cycle to be used well, it is important that everyone involved in the process has good training and is prepared and aligned with the proposed types of change. A horizontal, democratic environment is essential for activities to evolve and have everyone’s support.
Building team engagement with the company, its values and the desire to improve both personal performance and every process is key to successful planning.
So the ideal is to have a strategic planning system that helps increase, engage and boost your results, with visual resources that improve the company’s strategic deployment.
This business management system allows integrated tracking of corporate performance, as well as monitoring and centralizing all indicators, with a focus on decision making.
And, on the market, software that has all these characteristics is Stratwsopens in a new tab, which lets managers organize their work routine with better management and engagement of the whole team.
Our software offers all the quality tools that make your operation succeed. Talk to an expert!


About the author
Equipe Siteware
Content produced and reviewed by the Siteware team, curated by internal experts in strategic management and corporate performance.