
Strategy and Goals
Sales KPIs: What They Are and the Most Important Types
Learn how to define sales KPIs and avoid purposeless metrics. Connect your sales department's results to corporate performance.

Many professionals face enormous pressure every day to deliver predictable, scalable results. In a demanding environment, monitoring sales KPIs is no longer an analytical routine isolated within the sales department. It has taken a central role in executing corporate strategy.
Organizations that base decisions on intuition risk losing competitiveness, efficiency and operating margin.
That is why, in this article, we detail the concept of these indicators, how they differ from superficial metrics and best practices for connecting them to the company’s strategic planningopens in a new tab, ensuring continuous growth.
What are sales KPIs?
Sales KPIs (Key Performance Indicators) are used to evaluate the operation through quantitative values, carefully chosen to measure how effective sales teams are at reaching pre-established financial goals.
More than mere numbers on a dashboard, the concept works as the thermometer of corporate performance. It translates the sales force’s daily effort into tangible, auditable data, providing a solid basis for executive decision-making.
What is the strategic importance of KPIs for the sales team?
The importance of these indicators lies in their ability to provide an accurate, real-time diagnosis of the health of the company’s revenue generation.
In complex operations, empirical judgment loses its place at the decision table. Sales KPIs let managers identify bottlenecks in the negotiation funnel, reallocate resources intelligently and correct course proactively, well before the books close in the red.
By monitoring the landscape with analytical rigor, the sales leader leaves guesswork behind and guides the team based solely on facts. Constant tracking eliminates unpleasant surprises and ensures financial predictability, aligning the daily routine of the salesperson on the front line with the company’s broader objectives.
Read also: How to create performance indicators and align these KPIs with the company’s strategy?
What is the difference between common metrics and key performance indicators?
In the data-driven corporate ecosystem, there is a certain technical confusion between simple metrics and performance indicators.
Metrics are generic measures that only track the volume of an action, such as the total number of clicks on a campaign or the number of calls made by a representative. On their own, they show large numbers but do not reflect the company’s real financial success.
Sales KPIs, on the other hand, are tied to a strategic objective set by leadership.
While a metric says “we got 3,000 website visits,” a high-impact KPI reveals “our conversion rate from those visits hit 10%, resulting in R$1.5 million in new business.”
That is why every KPI derives from a metric, but not every metric carries the weight needed to guide important strategic decisions.
What are the main sales KPIs?
Structuring and defining which sales KPIs are ideal depends on the operating model, the complexity of the market and the customer’s decision cycle.
Knowing the main sales KPIs established in the global market helps managers build an indicator architecture that fits the company’s reality.
Below, we list examples of sales KPIs divided by the type of sales operation.
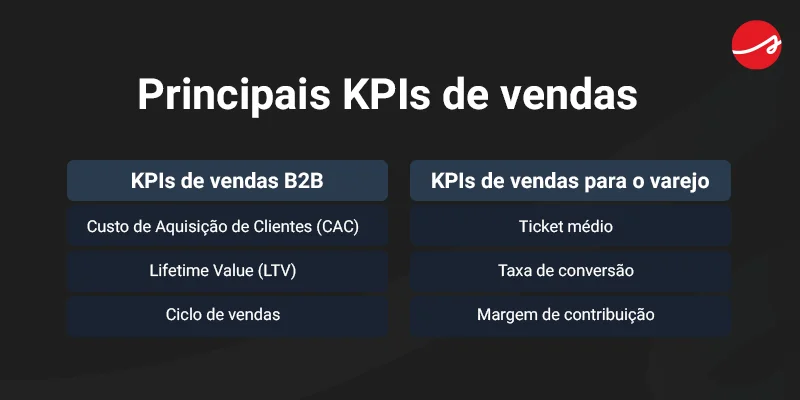
Examples of B2B sales KPIs
B2B operations are characterized by complex negotiations, long decision cycles, multiple decision makers and a substantially high average ticket.
To maintain financial stability in this scenario, the most important B2B sales KPIs are:
- Customer Acquisition Cost (CAC): measures the total investment allocated to attraction and negotiation needed to win a new contract. Continuous monitoring keeps the cost of prospecting from exceeding the financial return the customer generates.
- Lifetime Value (LTV): represents the estimated revenue a customer brings to the business during their active time in the portfolio. Maintaining a profitable ratio between LTV and CAC is the best thermometer of the company’s sustainability.
- Sales cycle: indicates the average time (in days or months) from the sales team’s first approach to the final signing of the contract. Excessively long cycles signal bureaucratic processes or difficulties in the negotiation stage.
Examples of sales KPIs for retail
Unlike the B2B scenario, retail managementopens in a new tab operates on the premise of fast inventory turnover and high cash volume, covering physical stores and large e-commerce operations.
As a result, sales KPIs for retail require monitoring focused on speed and on maximizing immediate consumption:
- Average ticket: determines the average amount spent per customer on each invoice issued. Increasing this value, driven by up-selling and cross-selling techniques, is the smartest path to growing revenue without raising acquisition cost.
- Conversion rate: measures the percentage of people who visited the store and completed a purchase. It is one of the main indicators for validating the return on marketing investment and proving the efficiency of the consumer experience.
- Contribution margin: reveals the amount left over from revenue after strictly deducting all direct and variable costs associated with the product. It is the amount used to pay fixed expenses and generate net profit.
How to connect sales KPIs to the company’s strategic planning
The management mistake that most compromises corporate growth occurs when revenue metrics operate in isolation under the exclusive command of the sales director.
For the organization to reach its maximum level of performance, sales KPIs need to be truly connected to strategic planning.
Mature methodologies, such as the Balanced Scorecard (BSC)opens in a new tab, make this integration possible. They ensure that the salesperson’s daily target on the front line faithfully reflects the broader objectives validated by the board of directors.
What are the risks of decentralized data and manual reports?
Managing indicator tracking in an environment where information is fragmented across tools that do not talk to each other drains corporate governance.
High-revenue organizations often run into the limitations of using local spreadsheets to monitor sales KPIs.
Manual spreadsheet control works in the short term; however, the method makes the routine unsustainable by generating information without standardization, speed and auditable traceability.
The manual labor involved in building reports pulls leadership away from the main managerial purpose: critical analysis of data. This failure leads to unproductive, draining meetings built around presentations with outdated numbers, instead of focusing on proactive levers for improving sales processes.
Read also: KPI management: how to do it in 6 practical stepsopens in a new tab
Which tool should you use to centralize sales KPI management and track corporate performance?
Sustaining an intense sales pace requires fail-safe technology for monitoring sales KPIs.
Siteware connects corporate planning to daily execution through Stratwsopens in a new tab, an ecosystem focused on centralizing end-to-end governance.
The software consolidates indicators in automated dashboards, promoting Visual Management to align leaders and salespeople with full analytical transparency.
The entire operation runs under rigorous international SOC 2 compliance (Azure/AWS cloud), ensuring auditability and maximum protection of strategic data.
Talk to an expert about Stratws and drive data-based decision-making in your organization.

About the author
Equipe Siteware
Content produced and reviewed by the Siteware team, curated by internal experts in strategic management and corporate performance.